 |
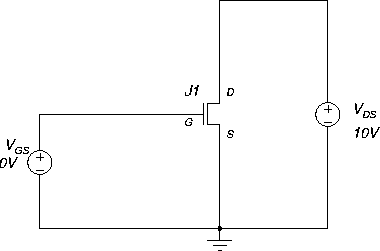
Load the PSPICE file jfet-dc1.sch, Figure 39.
Exercise:
Lecture Notes : FET Transistor Circuits : Introductory FET Circuits : SwitchWhen on a substantial current flows (order mA), while when off only a small current flows (order few
A or less). So look at the value of ID.
Note also the values of VGS and
.
Lecture Notes : FET Transistor Circuits : FET Models
VDS is set as the main sweep variable, ranging from 0 V to 10 V in increments of 0.1 V. VGS is the nested sweep variable, ranging from 0 V to -5 V in increments of 0.5 V.Simulate, and obtain the curves of Figure 41. Determine the correct value of VGS for each of the curves.
Note the similarities with the BJT characteristic curves IC vs VCE.In active mode, the BJT is like a current controlled current source:
, a function of IB.
In active mode, the FET is like a voltage controlled current source: ID = IDSS(1-VGS/Vp)2, a function of VGS.
The parameter values Vp and IDSS you have found will be used below (same JFET).
ANU Engineering - ENGN2211