next up previous contents

[ENGN2211 Home]

Active Filters

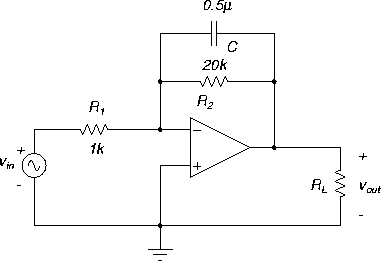
Load the PSPICE file activef1.sch, Figure 27.


Figure 27: Active filter.
\begin{figure}
\begin{center}
\epsfig{file=images/clab4img3.eps}\end{center}\end{figure}

Lecture Notes: Frequency Response : Active Filters

For the filter of Figure 27, Z1(s) = R1, $Z_2(s) = R_2 \parallel (1/sC)
= R_2/(1+s R_2 C)$. Then

\begin{displaymath}H(s) = - \frac{Z_2(s)}{Z_1(s)} = -\frac{(R_2/R_1)}{1+s R_2 C}
\end{displaymath}

and so

\begin{displaymath}H(j\omega) = - \frac{(R_2/R_1)}{1+j\omega R_2 C}
\end{displaymath}

The DC gain corresponds to $\omega = 0$ and equals in magnitude

\begin{displaymath}\vert H(j0) \vert = R_2/R_1, \ \ \ {\rm or} \ \ \vert H(j0) \vert (dB) = 20 \log_{10}(R_2/R_1) \ {\rm dB}
\end{displaymath}

The high frequency gain corresponds to $\omega = \infty$ and equals in magnitude

\begin{displaymath}\vert H(j\infty) \vert = 0, \ \ \ {\rm or} \ \ \vert H(j\infty) \vert(dB)=-\infty \ {\rm dB}
\end{displaymath}

The 3dB point is

\begin{displaymath}\omega_{3dB} = \frac{1}{R_2 C} \ \ {\rm rad/sec}, \ \
{\rm or} \ \ f_{3dB} = \frac{\omega_{3dB}}{2\pi} \ \ {\rm Hz}
\end{displaymath}

Exercise:

1.
Simulate the active filter circuit and obtain the magnitude and phase Bode diagrams.

2.
What type of filter is it? Find the 3 dB point. What is the DC gain? What is the high frequency gain?

3.
By changing component value(s), increase the 3 dB point by one decade (Hz) and re-simulate to check.
One decade means a factor of 10, so work out new values of R1, R2 or C to increase f3dB by 10, keeping the DC gain unchanged.

4.
By changing component value(s), change the magnitude of the pass band gain to 10 dB, and re-simulate to check.
Work out new values of R1, R2 or C to achieve a new DC gain of 10 dB (what is this in the absolute scale?) keeping the 3dB point unchanged.


next up previous contents

[ENGN2211 Home]

ANU Engineering - ENGN2211