

[ENGN2211 Home]
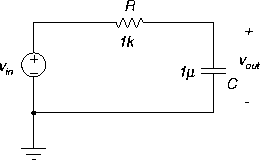
Load the series RC circuit in
PSPICE file
rc-trans.sch,
Figure 21.
Here,
Figure 21:
RC circuit.
 |
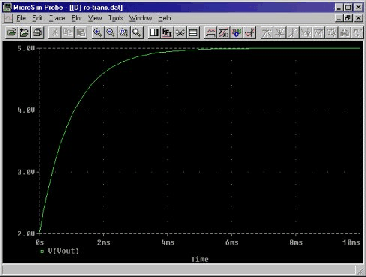
Figure 22:
RC transient waveform.
 |
Exercise:
- 1.
- Simulate the circuit and obtain the transient response
of Figure 22 (capacitor
voltage - add a voltage marker if necessary).
- 2.
- From the graph, determine the time constant
 and the final
DC steady state value.
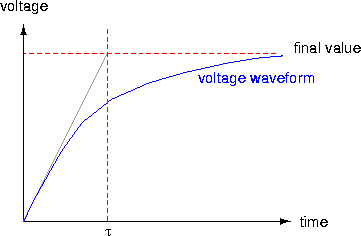
You will need to estimate the initial slope of the waveform
to determine  as shown in Figure 23.
Use two probe cursors to obtain data values.
Figure 23:
RC transient waveform: estimation of time constant from straight line
with slope equal to initial slope of waveform.
 |
- 3.
- Experiment with different component values and record
the effect on the time constant in a table.
Determine an empirical relationship between the
time constant
 and resistance R.
Compare with theory.


[ENGN2211 Home]
ANU Engineering - ENGN2211
as shown in Figure 23. Use two probe cursors to obtain data values.