next up previous contents index

[ENGN2211 Home]

Full-Wave Rectifiers

  In the half-wave rectifier the voltage is zero for half of the cycle. Full-wave rectifiers are designed using two or more diodes so that voltage is produced over the whole cycle.

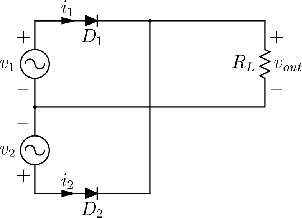
Figure 83 shows a full-wave rectifier designed using two diodes and a center-tapped AC supply (i.e. center-tapped transformer).


Figure 83: Center-tapped full-wave rectifier.
\begin{figure}
\begin{center}
\epsfig{file=images/diodeimg18.eps}\end{center}\end{figure}

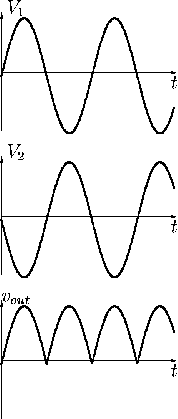
The waveforms are shown in Figure 84. The center tapping implies that the two source voltages v1 and v2 are a half cycle out of phase. We see that diode D1 conducts when source v1 is positive, and D2 conducts when v2 is positive, giving the waveform vout.


Figure 84: Full-wave rectifier waveforms.
\begin{figure}
\begin{center}
\epsfig{file=images/diodeimg20.eps}\end{center}\end{figure}

The average or DC value of the waveform vout is now

 \begin{displaymath}V_{AVE} = \frac{2V_{m(out)}}{\pi}
\end{displaymath} (79)

since the waveform is non-zero twice as much as in the half-wave case. Here, Vm(out) equals Vm if we regard the diodes as ideal, and equal to Vm -0.7 V if we use the practical model.

The peak inverse voltage  is

\begin{displaymath}PIV = 2V_m -0.7 \ V
\end{displaymath}

(why?)

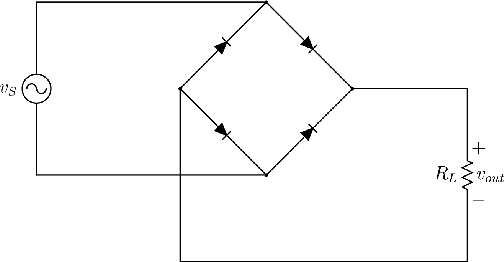
Figure 85 shows a bridge rectifier  built from four diodes and a single AC source. The waveform of vout is the same as for the center-tapped full-wave rectifier.


Figure 85: Bridge full-wave rectifier.
\begin{figure}
\begin{center}
\epsfig{file=images/diodeimg19.eps}\end{center}\end{figure}

The average voltage for the bridge rectifier is the same as in (79) but the peak inverse voltage is

\begin{displaymath}PIV = V_m - 0.7\ V
\end{displaymath}

(again, why?)


next up previous contents index

[ENGN2211 Home]

ANU Engineering - ENGN2211