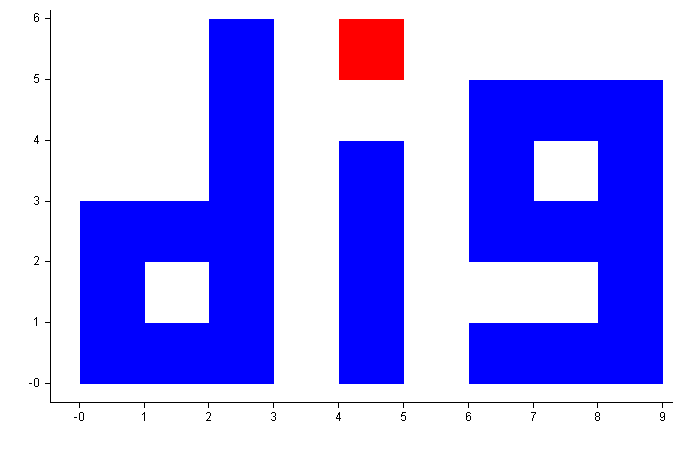
Dig: XY plotting / Graph drawing

Dig is an extension of the xgraph idea. It takes a simple ASCII file and draws on-screen plots based on commands in the file. You can then view the plot using zoom, pan etc.

It allows programs to write simple files that let their developers visualise their output.

DIG is is not intended to produce publication-quality graphics. Use Grace for that. Instead, it is for quick data visualisation.

Facilities
  • 2D plots (also called line plots, x-y plots)
  • Draw lines
  • Draw graphs
  • Automatic X/Y axis labelling
  • Scatter plots
  • Labelled points
  • Coloured boxes
  • Scaled circles
  • Box-and-whisker plots
  • Allows X/Y tic labels
  • Simple animations
Interactions
  • Zoom in/out
  • Pan
  • Autoscale
  • Find labels
  • Screen dump as jpg/gif etc.

Dig is freeware.

Screen Shots (with example files) Manual Download

Author: Philip Kilby