


Next: Conclusions
Up: Some SAT Benchmarks Visualised
Previous: Parity Problem
Randomly generated synthetic problems, from the DIMACS benchmark suite, problem
dubois20.cnf. Each graph shows quite a different structural interpretation, illustrating
both the potential difference between the graph interpretation of the problem, as well as
how this effects the graph layout algorithm.
Figure 13:
A Synthetic Benchmark, Cooccurrence of Variables
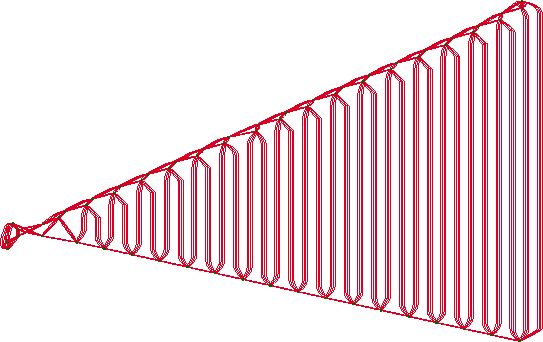 |
Figure 14:
A Synthetic Benchmark, Cooccurrence of Literals
 |
Figure 15:
A Synthetic Benchmark, Basic Implicative Interpretation
 |
Last modified: 2004-03-17
Andrew Slater