The Analysis of Variations - a reply to Doron Witztum
Brendan McKay, Australian National University
Witztum, Rips and Rosenberg (WRR) claimed to prove the existence of a hidden code in the Bible by an experiment that involved the names and appellations of famous rabbis, together with their dates of birth or death. The two main aspects of their experiment deserving of critical scrutiny are the data and the experimental method. Our reply in Statistical Science examined both of these in detail, and came to the conclusion that the data collection process is especially suspect, particularly with regard to the selection of appellations and their spellings.
Although this conclusion has been established beyond reasonable doubt by direct means, we also conducted an innovative indirect investigation. WRR's experimental method involves a large number of options and parameters, of various degrees of arbitrariness. We identified each of the basic options and determined the effect of varying them. What we found was that, in the great majority of cases, changing a parameter of WRR's experimental method made their result weaker.
There are a number of possible explanations for our observation, but before discussing them it is important to realise that the mere fact that WRR's result depends heavily on the analysis method is reason enough to bring it's conclusions into question. There are literally millions of ways their data could have been analysed, but it seems that only WRR's method or methods closely related to it give such a strong result. This allows the possibility that something unusual about the way the experiment was designed or conducted may be responsible for the result, rather than requiring an explanation involving miraculous properties of the text.
Returning to possible explanations, the suggestion we hear most often is that WRR adjusted their experimental method to strengthen their result. However, the known historical facts make it hard to see how such adjustment could have been achieved other than to a limited extent. (However, we revisit this conclusion below.) In our paper, we suggested an alternative explanation: the near-optimum state of the experimental method is a side-effect of biased selection of the data.
Witztum has now published a reply in which he presents an impressive amount of computation and argument. As usual for Witztum's articles, most of it is either factually false or fails to make scientific sense. Nevertheless, and somewhat to our surprise, there are a few worthwhile points made here and there amongst the chaff. Our purpose in this note is to identify those points and answer them.
Disclaimer: Unfortunately, this article can only be appreciated by those few who are familiar with the fine details of our paper and the ensuing debate.
We will refer to a change in WRR's experimental method as a variation. Of the many claims that Witztum makes, two are worthy of mention.
The variations we presented were determined by examining the paper of WRR in great detail and identifying all the points at which an arbitrary choice was made. The refutation of Witztum's first claim is that he did not manage to identify a single variation which tells a contrary story and should have been presented but was not.
Of course, Witztum does not agree with this statement and gives examples which he claims to support his position. The most important of these involve parameters which take numerical values. WRR gave each such parameter one value but other values could be considered. The difficulty for presentation is that there are infinitely many possible values and there is only space to present a few. This gave us some freedom of choice, and Witztum claims we used the freedom to bias our presentation.
The approach we took was in fact correct and justified. In each case, we presented some "round" values either side of the value WRR used. For example, if WRR used the value 10, we tried 5, 15, 20, 25, and 50 (for example). Witztum claims we should have tried values like 8 and 13, and gave a few examples where such values (he claims) refute our conclusions. A particular argument of Witztum is that we should have presented values very close to WRR's value so as to properly check our claim that WRR's value is the optimum value.
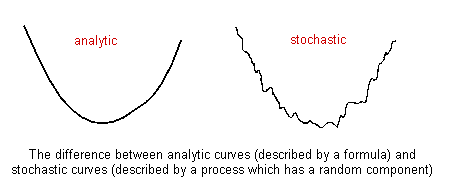
There are two major errors in Witztum's case. First, it should be obvious that restricting ourselves to "round" values reduced our choice rather than expanding it. In fact it is hard to see how we could have made more natural choices than we did. Second, Witztum fails to notice the difference between analytic and stochastic functions. Consider the two curves in the following figure.
For the curve on the left, moving a little either side of the minimum raises the function value a little. So, in that case, one can identify the position of the minimum accurately by looking at points close together. However, for the curve on the right looking at points close together can only show the fine wriggles in the curve and not its general shape. To determine the general position of the lower part of the curve, we have to look at points more widely separated.
Since WRR's experiment is a statistical one, the result is a stochastic function of each parameter, so curves similar to that on the right are to be expected. The overall shape of the curve, which is the property of statistical importance, is best determined by examining points spaced more widely than the fine wriggles. Exactly as we did.
Another batch of Witztum's criticisms are essentially that we presented too much information. If we presented 6 values of a parameter, he would say that we should have presented only 4, and so on. Note how these criticisms contradict Witztum's earlier criticisms and how they are a direct affront to the intelligence of the reader. Witztum is really saying that information in his favour should be shown and information against him should be suppressed. In other words, that we should write our papers using the standards he applies to his.
Witztum presents a number of examples in support of this claim, of which the sensible examples are our tuning demonstration with War and Peace and the experiment we did using data independently prepared by Dr. Simcha Emanuel.
The first of these, which we will call WNP, involved deliberately making changes to WRR's data in order to create a strong "codes" result using War and Peace instead of Genesis as a text. Witztum claims that our analysis of variations does not detect our acknoweldged tuning of the data, and so we cannot claim that it detects tuning in his data either.
The second example, which we will call SEG, was a genuine codes experiment with Genesis, where WRR's data was replaced by data independently prepared for us by an specialist in rabbinical history. Witztum claims that our analysis of variations does detect data tuning in SEG, and so we should either admit that our method is faulty or admit that SEG was faked.
Despite initial appearances, Witztum does not actually demonstrate the facts he alleges, and he is also incorrect in the conclusions he draws. The most serious, and fatal, flaw is his sole reliance on raw counts. That is, he has taken the variations we list and counted how many of them make the result worse, then used this count as his only measure for comparing two experiments. However, this is completely invalid. As is stated clearly in our paper, and even repeated approvingly by Witztum, the variations are not independent but strongly related to each other in complicated ways. Moreover, Witztum's count depends on the arbitrary choice of which sample values are presented for numerical parameters (see above) and so cannot represent an intrinsic property of the data.
It is clear from Witztum's paper that he is painfully aware of this error in his argument. He claims that we made this error ourselves (even though we did not even present the raw counts let alone base our case on them), then invokes the concept of "psychological impact" to justify making the same error repeatedly himself. This is not the way that science is done. There is no crime in discussing psychological impact, but presenting it in the guise of hard scientific data is inexcusable.
To illustrate the sort of information that a more careful analysis might make available, we will present some simple examples of numerical parameters. First, WRR define a parameter that defines which ELSs of a word are included in their calculation. They gave it the value 10. It is a good example because WRR wrote at least 3 times that their choice of value is to reduce the computational effort and not because it is required by their research hypothesis. The following chart shows the effect of varying this parameter. The vertical axis represents the "significance level", so lower is stronger.
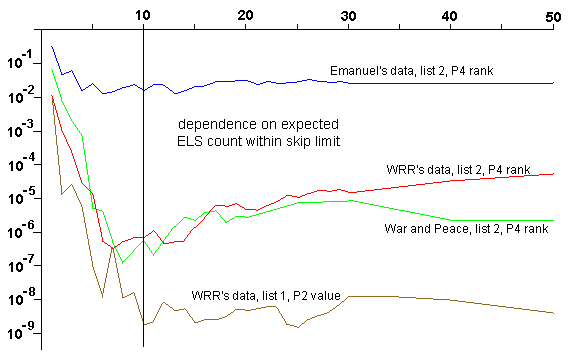
We see in the picture that the value 10 is near to optimal for the experiment published by WRR in Statistical Science (the red line). It is not the very best value, but the general shape of the curve has its minimum quite close to 10. As explained above, the general shape is what matters. Interestingly, our demonstration WNP shows almost identical behaviour (the green line), whereas the experiment SEG does not show it at all. Note that both observations are the opposite of what Witztum claims.
Also in the picture (brown line) is the primary success measure of WRR's first list of rabbis. We see that the curve doesn't have such a well-defined minimum but rather flattens off near WRR's value.
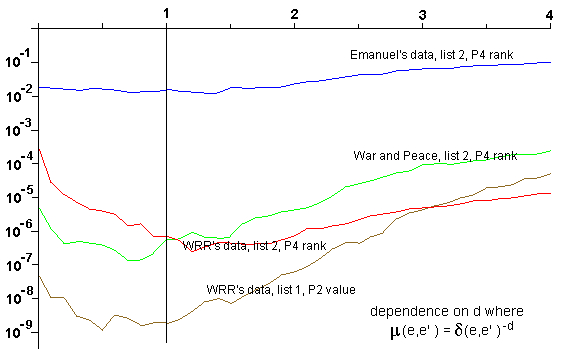
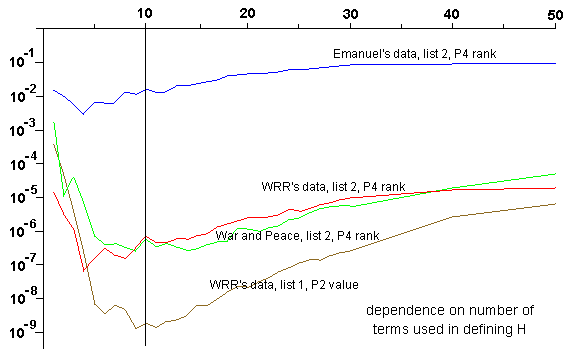
By way of comparison, we show similar plots for two other parameters. The first is an exponent giving the relative importance of different distances (see our paper for the details). The second is a parameter giving (roughly speaking) the maximum number of rows of a letter array between two letters of an ELS. The behaviour in each case is somewhat different but still totally contrary to Witztum's claims.
Regression to the mean is a standard statistical principle with a rigorous mathematical basis. A simple example is as follows. Suppose there are 100 schools, which are compared according to the reading skills of their pupils. One year later, they are compared again. The principle of regression to the mean says that the schools performing best in the first test will, on average, perform somewhat worse on the second test, and the schools performing worst on the first test will, on average, perform somewhat better on the second test.
This principle has an immediate application to the analysis of variations. If a statistical experiment obtains a result that is exceptionally good by pure luck, or because the data is selected to perform exceptionally well, or because the experiment itself is selected from many possible experiments on the basis of its good result, then we can expect that minor variations of the experiment will usually made the result worse.
For the same reason, these facts show another glaring error in Witztum's reasoning. He claims that we are making the logical implication from "variations usually make the result worse" to "the data was tuned". Then he shows examples where (according to him) variations make the result worse yet the data was not tuned, and concludes from this that our logical implication is therefore wrong. However, this is merely the defeat of a strawman. We do not make this logical implication at all, but rather allow the multiple explanations listed in the previous paragraph. Unfortunately for Witztum, all those explanations are bad for him. For example, Witztum is unlikely to agree that his results are due to pure luck.
However, these various explanations are not all bad for us, as for example with the experiment using the data written by Simcha Emanuel. Its result is not statistically significant, but since it is somewhat low it is to be expected that variations will tend to make it worse. And so they do (but to a much weaker degree than for WRR's experiment). This does not imply that Emanuel's data was cooked, because there are other realistic explanations including pure luck (which in this case is not all that unlikely) and some tweaking of the measurement method by WRR (see the next section).
Since the publication of our paper, it has become clear that tuning of the data alone might not be a complete explanation for the remarkable consistency in which variations make WRR's result (second list) worse. We thank Witztum for contributing to this evidence.
Therefore, while we still believe that data selection was the primary source of the phenomenon, we acknowledge the possibility of other factors. In particular, we want to reconsider whether the success measure was itself tuned. There are few aspects of the measure (such as the details in the definition of the permutation test) where such tuning was clearly an option, but there are other more subtle possibilities. Note that there are at least three steps in the process:
From this we can postulate that some amount of direct tuning of the success measure may have contributed to the result of our analysis of variations. The changes between M2 and M3 are especially interesting in this respect. Nevertheles, the degree to which this explanation is significant is impossible to determine.
Back to Bible Codes Refuted
Creator: Brendan McKay, bdm@cs.anu.edu.au.